Page 121 - SST Class 06
P. 121

90 O
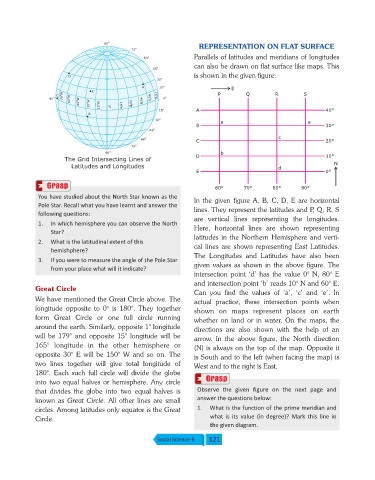
                                                                      REPRESENTATION ON FLAT SURFACE
                                              75 O
                                                   60 O             Parallels of latitudes and meridians of longitudes
                                                                    can also be drawn on flat surface like maps. This
                                                      45 O
                         D                                          is shown in the given figure:
                                                       30 O
                                                  A     15 O                     E
                                 E
                      O W                              75                   P         Q         R         S
                     C   O W                        60
                  90 O  75  O W                   45   O E  0 O
                         60    O W  O W       30     O E
                            45            15      O E
                                30  15  0 O  O E  O E
                                                        15 O         A                                            40°
                                B
                                                       30 O                  a                             e
                                                                     B                                            30°
                                                     45 O
                                                                                                 c
                                                  60 O
                                                                     C                                            20°
                                              75 O
                                     90 O                                    b
                                                                     D                                            10°
                       The Grid Intersecting Lines of
                                                                                                                     N
                          Latitudes and Longitudes                                               d
                                                                     E                                            0°
                                                                           60°       70°       80°       90°
              You have studied about the North Star known as the
                                                                    In the given figure A, B, C, D, E are horizontal
              Pole Star. Recall what you have learnt and answer the
                                                                    lines. They represent the latitudes and P, Q, R, S
              following questions:
                                                                    are  vertical  lines  representing  the  longitudes.
              1.  In which hemisphere you can observe the North
                                                                    Here,  horizontal  lines  are  shown  representing
                   Star?
                                                                    latitudes in the Northern Hemisphere and verti-
              2.  What is the latitudinal extent of this
                                                                    cal  lines  are  shown  representing  East  Latitudes.
                   hemishphere?
                                                                    The  Longitudes  and  Latitudes  have  also  been
              3.  If you were to measure the angle of the Pole Star
                                                                    given values as shown in the above figure. The
                   from your place what will it indicate?
                                                                    intersection  point  ‘d’  has  the  value  0°  N,  80°  E
                                                                    and intersection point ‘b’ reads 10° N and 60° E.
             Great Circle
                                                                    Can  you  find  the  values  of  ‘a’,  ‘c’  and  ‘e’.  In
             We have mentioned the Great Circle above. The          actual  practice,  these  intersection  points  when
             longitude  opposite  to  0°  is  180°.  They  together   shown  on  maps  represent  places  on  earth
             form  Great  Circle  or  one  full  circle  running    whether  on  land  or  in  water.  On  the  maps,  the
             around the earth. Similarly, opposite 1° longitude     directions  are  also  shown  with  the  help  of  an
             will  be  179°  and  opposite  15°  longitude  will  be   arrow.  In  the  above  figure,  the  North  direction
             165°  longitude  in  the  other  hemisphere  or
                                                                    (N) is always on the top of the map. Opposite it
             opposite  30°  E  will  be  150°  W  and  so  on.  The
                                                                    is South and to the left (when facing the map) is
             two  lines  together  will  give  total  longitude  of
                                                                    West and to the right is East.
             180°.  Each  such  full  circle  will  divide  the  globe
             into two equal halves or hemisphere. Any circle
             that  divides  the  globe  into  two  equal  halves  is   Observe  the  given  figure  on  the  next  page  and
             known as Great Circle. All other lines are small        answer the questions below:
             circles. Among latitudes only equator is the Great      1.  What is the function of the prime meridian and
             Circle.                                                      what  is  its  value  (in  degree)?  Mark  this  line  in
                                                                          the given diagram.

                                                       Social Science-6  121
   116   117   118   119   120   121   122   123   124   125   126