
Page 187 - SST Class 08
P. 187
forty years after that, the world’s population growth, e.g., Kenya. Some countries, on the
doubled and became 6 billon in 1999. This could other hand, are showing de-growth in popula-
happen because of better food supplies, health tion, e.g., UK and many European countries.
facilities. Death rate reduced and birth rate Population Composition
remained fairly high during this period.
The population composition of a country tells
Birth Rate : The number of live births per about age profile, sex, literacy level, health
1,000 people is called birth rate. condition, occupation and income level. Thus,
Death Rate : The number of deaths per 1,000 the structure of the population is called popula-
people is called death rate. tion composition.
When the death rate is more than the birth rate, Population Pyramid : A population pyramid is
it will lead to de-growth in population. When the a graphical representation of population compo-
birth rate is equal to death rate, there will be no sition. In a population pyramid, the total popula-
growth in population. When the birth rate is tion is divided into various age groups, e.g., 5 to
higher than death rate, it will lead to growth in 9 years, 10 to 14 years, etc. For each age group,
population. The difference between birth rate the percentage of the total population is subdi-
and death rate is called natural growth rate of vided into males and females.
population.
The relative number of children (below 15 years)
Life Expectancy : The number of years that an and that of the elderly (above 65 years) shows
average person is expected to live is called life
the relative number of dependents in the popula-
expectancy. tion. The relative number of people in the
Migration : When people move from one place working age (between 15 and 65 years) shows
to another in search of livelihood, it is called the relative number of productive people.
migration.
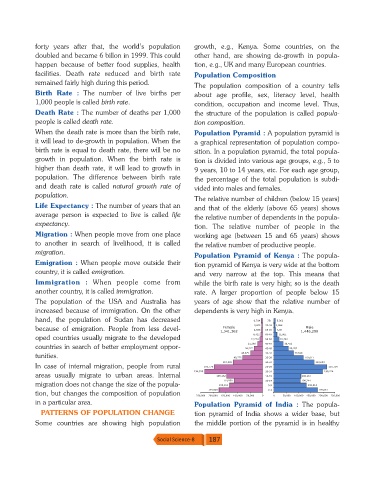
Population Pyramid of Kenya : The popula-
Emigration : When people move outside their tion pyramid of Kenya is very wide at the bottom
country, it is called emigration. and very narrow at the top. This means that
Immigration : When people come from while the birth rate is very high; so is the death
another country, it is called immigration. rate. A larger proportion of people below 15
The population of the USA and Australia has years of age show that the relative number of
increased because of immigration. On the other dependents is very high in Kenya.
hand, the population of Sudan has decreased 6,714 75+ 5,362
3,835 70-74 4,096
because of emigration. People from less devel- Female Male
1,341,362 4,838 65-69 6,00 1,446,298
8,422 60-64 12,901
oped countries usually migrate to the developed 12,224 55-59 20,743
21,298 50-54 38,412
countries in search of better employment oppor- 34,272 45-49 58,287
48,679 40-44 79,518
tunities. 80,775 35-39 119,611
119,326 30-34 163,653
In case of internal migration, people from rural 195,779 25-29 215,704
234,019 20-24 198,224
areas usually migrate to urban areas. Internal 145,132 15-19 108,167
114,959 10-14 106,244
migration does not change the size of the popula- 135,161 5-9 132,014
175,929 0-4 176,861
tion, but changes the composition of population
250,000 200,000 150,000 100,000 50,000 0 0 50,000 100,000 150,000 200,000 250,000
in a particular area. Population Pyramid of India : The popula-
PATTERNS OF POPULATION CHANGE tion pyramid of India shows a wider base, but
Some countries are showing high population the middle portion of the pyramid is in healthy
Social Science-8 187