
Page 180 - Maths Class 04
P. 180
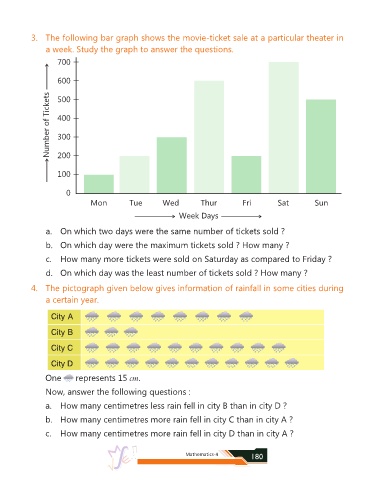
3.  The following bar graph shows the movie-ticket sale at a particular theater in

                 a week. Study the graph to answer the questions.

                     700


                     600

                  Number of Tickets  400
                     500


                     300


                     200


                     100


                        0
                                Mon           Tue        Wed          Thur           Fri         Sat          Sun

                                                               Week Days

                 a.  On which two days were the same number of tickets sold ?

                 b.  On which day were the maximum tickets sold ? How many ?

                 c.  How many more tickets were sold on Saturday as compared to Friday ?

                 d.  On which day was the least number of tickets sold ? How many ?

            4.  The pictograph given below gives information of rainfall in some cities during

                 a certain year.


                   City A

                   City B

                   City C


                   City D

                 One      represents 15 cm.

                 Now, answer the following questions :

                 a.  How many centimetres less rain fell in city B than in city D ?

                 b.  How many centimetres more rain fell in city C than in city A ?

                 c.  How many centimetres more rain fell in city D than in city A ?


                                                                 Mathematics-4          180