
Page 202 - Maths Class 05
P. 202
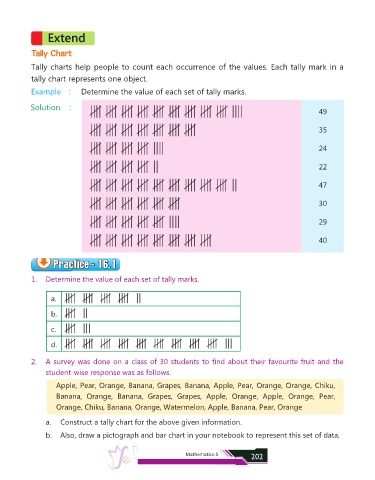
Tally Chart


            Tally charts help people to count each occurrence of the values. Each tally mark in a
            tally chart represents one object.

            Example  :       Determine the value of each set of tally marks.

            Solution     :
                                                                                                               49


                                                                                                               35


                                                                                                               24


                                                                                                               22


                                                                                                               47


                                                                                                               30


                                                                                                               29


                                                                                                               40


                    Practice - 16.1
                    Practice - 16.1
                    Practice - 16.1
                    Practice - 16.1
            1.  Determine the value of each set of tally marks.


                   a.

                   b.

                   c.


                   d.

            2.  A survey was done on a class of 30 students to find about their favourite fruit and the

                 student-wise response was as follows.
                    Apple, Pear, Orange, Banana, Grapes, Banana, Apple, Pear, Orange, Orange, Chiku,

                    Banana,  Orange,  Banana,  Grapes,  Grapes,  Apple,  Orange,  Apple,  Orange,  Pear,
                    Orange, Chiku, Banana, Orange, Watermelon, Apple, Banana, Pear, Orange

                 a.  Construct a tally chart for the above given information.

                 b.  Also, draw a pictograph and bar chart in your notebook to represent this set of data.


                                                                 Mathematics-5          202