
Page 204 - Maths Class 05
P. 204
a. What vegetables does the farmer have the fewest of ?
b. What vegetables does he have the most of ?
c. How many vegetables does the farmer have in total ?
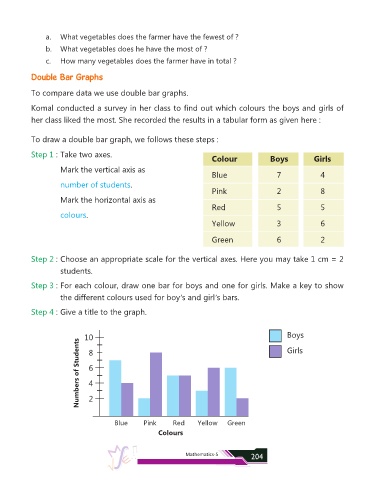
Double Bar Graphs
To compare data we use double bar graphs.
Komal conducted a survey in her class to find out which colours the boys and girls of
her class liked the most. She recorded the results in a tabular form as given here :
To draw a double bar graph, we follows these steps :
Step 1 : Take two axes.
Colour Boys Girls
Mark the vertical axis as
Blue 7 4
number of students .
Pink 2 8
Mark the horizontal axis as
Red 5 5
colours.
Yellow 3 6
Green 6 2
Step 2 : Choose an appropriate scale for the vertical axes. Here you may take 1 cm = 2
students.
Step 3 : For each colour, draw one bar for boys and one for girls. Make a key to show
the different colours used for boy’s and girl’s bars.
Step 4 : Give a title to the graph.
10 Boys
Numbers of Students 6
Girls
8
4
2
Blue Pink Red Yellow Green
Colours
Mathematics-5 204