
Page 207 - Maths Class 05
P. 207
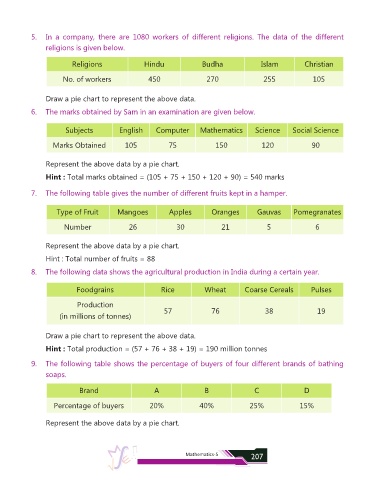
5.  In  a  company,  there  are  1080  workers  of  different  religions.  The  data  of  the  different

                 religions is given below.

                          Religions                Hindu               Budha               Islam          Christian

                       No. of workers               450                 270                 255              105


                 Draw a pie chart to represent the above data.

            6.  The marks obtained by Sam in an examination are given below.


                        Subjects          English      Computer       Mathematics        Science      Social Science

                   Marks Obtained           105            75              150             120               90


                 Represent the above data by a pie chart.

                 Hint : Total marks obtained = (105 + 75 + 150 + 120 + 90) = 540 marks

            7.  The following table gives the number of different fruits kept in a hamper.


                     Type of Fruit        Mangoes          Apples         Oranges         Gauvas      Pomegranates

                       Number                 26              30              21             5                6


                 Represent the above data by a pie chart.

                 Hint : Total number of fruits = 88

            8.  The following data shows the agricultural production in India during a certain year.


                            Foodgrains                   Rice           Wheat         Coarse Cereals         Pulses

                            Production
                                                          57              76                 38                19
                      (in millions of tonnes)


                 Draw a pie chart to represent the above data.

                 Hint : Total production = (57 + 76 + 38 + 19) = 190 million tonnes

            9.  The following table shows the percentage of buyers of four different brands of bathing
                 soaps.


                            Brand                     A                 B                C                D

                    Percentage of buyers             20%              40%              25%               15%


                 Represent the above data by a pie chart.


                                                                 Mathematics-5          207