
Page 205 - Maths Class 05
P. 205
Practice - 16.2
Practice - 16.2
Practice - 16.2
Practice - 16.2
1. Draw a double bar graph to compare the favourite ice-cream flavours of boys and girls in
a class whose data is as given below.
Flavours Vanilla Chocolate Strawberry Butterscotch
Boys 9 6 4 8
Girls 5 10 12 7
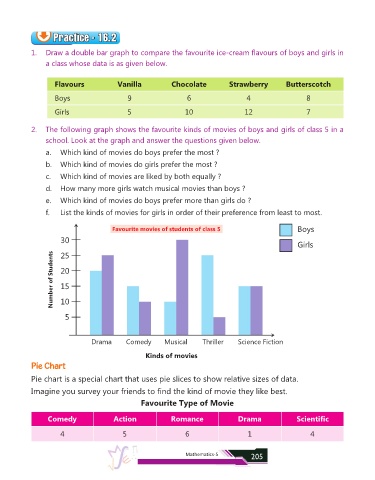
2. The following graph shows the favourite kinds of movies of boys and girls of class 5 in a
school. Look at the graph and answer the questions given below.
a. Which kind of movies do boys prefer the most ?
b. Which kind of movies do girls prefer the most ?
c. Which kind of movies are liked by both equally ?
d. How many more girls watch musical movies than boys ?
e. Which kind of movies do boys prefer more than girls do ?
f. List the kinds of movies for girls in order of their preference from least to most.
Favourite movies of students of class 5 Boys
30
Girls
Number of Students 20
25
15
10
5
Drama Comedy Musical Thriller Science Fiction
Kinds of movies
Pie Chart
Pie chart is a special chart that uses pie slices to show relative sizes of data.
Imagine you survey your friends to find the kind of movie they like best.
Favourite Type of Movie
Comedy Action Romance Drama Scientific
4 5 6 1 4
Mathematics-5 205